Skip to content
English
Italiano
English
Show submenu for translations
Home
Solutions
Show submenu for Solutions
Case Study
Show submenu for Case Study
Agriculture
Health
Industry
Smart Building
Smart City
OEM
Utility
Use Cases
Products
Show submenu for Products
Urbana ONE
UNaaS
IoT Platform & Toolkit
Network
Devices
About Us
Show submenu for About Us
Careers
Resource Center
Open main navigation
Close main navigation
Home
Solutions
Show submenu for Solutions
Case Study
Show submenu for Case Study
Agriculture
Health
Industry
Smart Building
Smart City
OEM
Utility
Use Cases
Products
Show submenu for Products
Urbana ONE
UNaaS
IoT Platform & Toolkit
Network
Devices
About Us
Show submenu for About Us
Careers
Resource Center
English
Italiano
English
Show submenu for translations
Contact us
Contact us
Build Your Project
with our ioT devices
We work closely with our partners to ensure you get the best of the breed when it comes to build your next IoT project.
Discover our device portfolio from world-class Partners
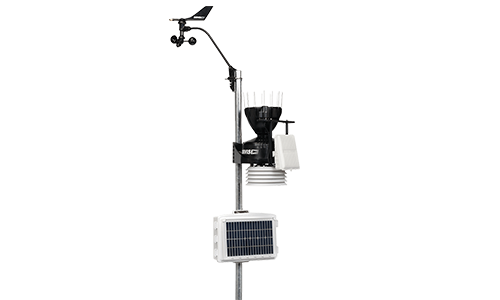
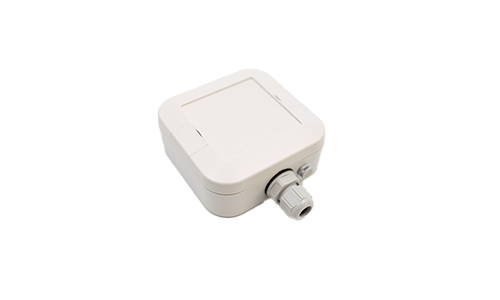
Weather Station
Manufacturer
: Enginko
Manufacturer Product ID
: MCF-LWWS00
Urbana Product ID
: WH01EU00T_00
Industry
: City, Agriculture
Technology
: LoRaWAN
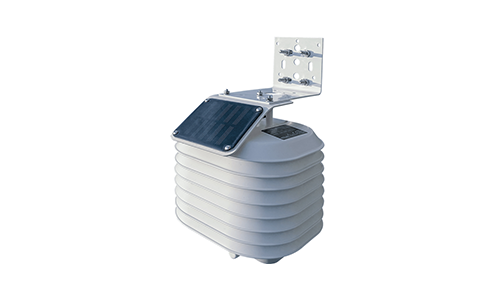
Environmental Sensor
Manufacturer
: Enginko
Manufacturer Product ID
: MCF-LW12TERPM
Urbana Product ID
: PM01EU0BT_00
Industry
: City
Technology
: LoRaWAN
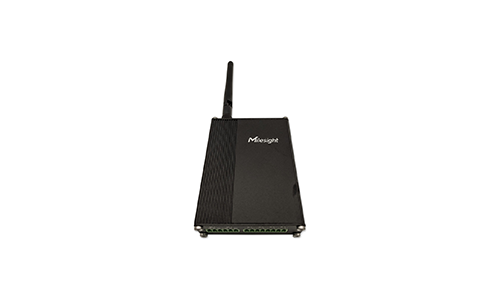
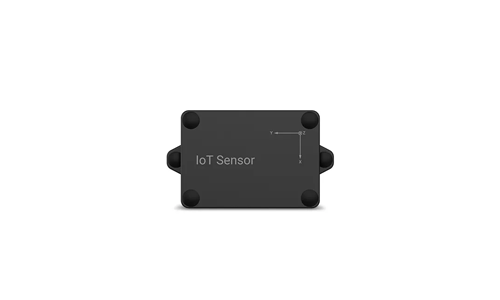
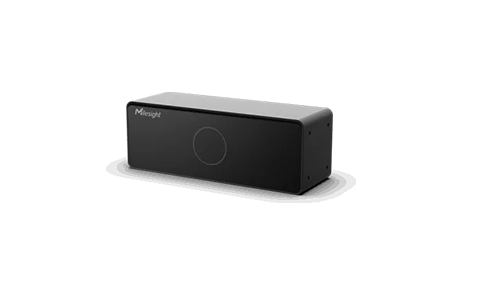
IoT Controller
Manufacturer
: Milesight
Manufacturer Product ID
: UC300
Urbana Product ID
: IO03EU00T_00
Industry
: Building, City, Utility, Industry
Technology
: LoRaWAN
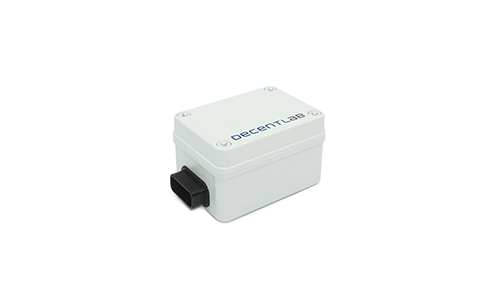
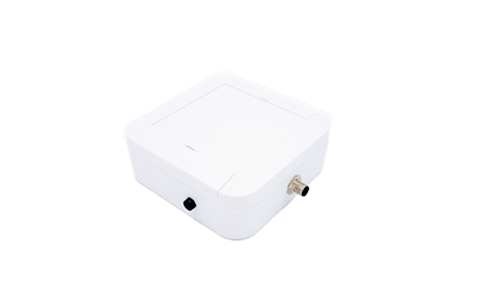
Air Quality (PM) Sensor
Manufacturer
: Decentlab
Manufacturer Product ID
: DL-LP8P
Urbana Product ID
: PM02EU0BT_00
Industry
: Building, City
Technology
: LoRaWAN
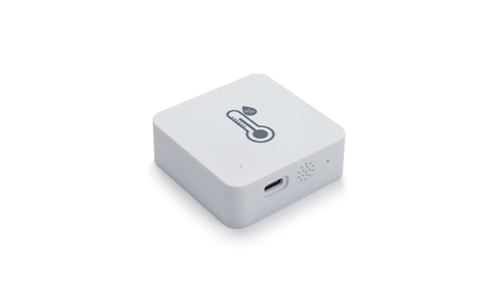
Temperature & Humidity Sensor
Manufacturer
: Milesight
Manufacturer Product ID
: EM300-TH
Urbana Product ID
: AM04EU0BT_00
Industry
: Building, City
Technology
: LoRaWAN
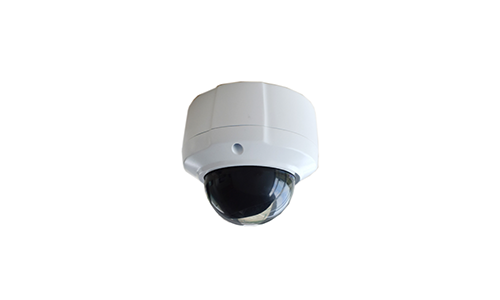
Smart Parking Camera AI
Manufacturer
: Urbana
Manufacturer Product ID
:
CCAIEU000_00
Urbana Product ID
: CCAIEU000_00
Industry
: City
Technology
: LoRaWAN
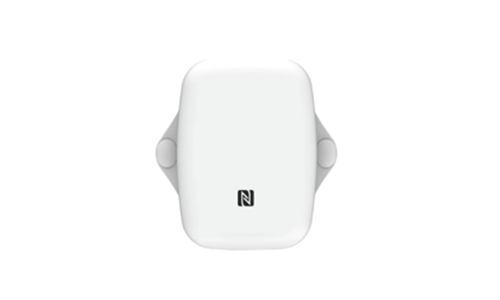
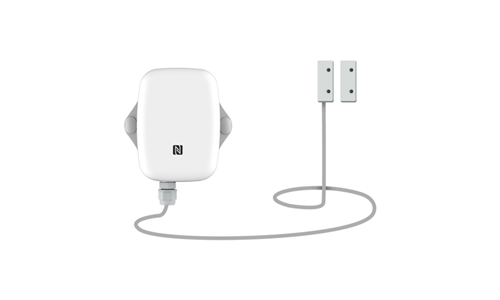
Magnetic Contact Sensor
Manufacturer
: Milesight
Manufacturer Product ID
: EM300-MCS
Urbana Product ID
: WS03EU00BT_00
Industry
: Building, City
Technology
: LoRaWAN
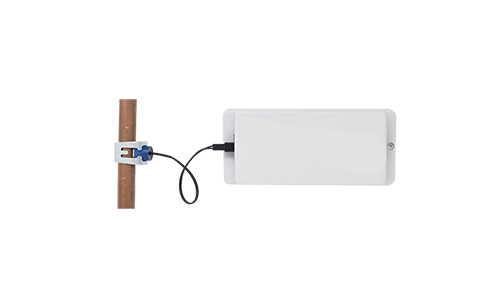
Pulse Counter
Manufacturer
: Milesight
Manufacturer Product ID
: EM300-DI
Urbana Product ID
:
IO06EU0BT_00
Industry
: Building, City, Utility
Technology
: LoRaWAN
Tilt Sensor
Manufacturer
: Milesight
Manufacturer Product ID
: EM310-TILT
Urbana Product ID
: TS01EU0BT_00
Industry
: Building, City, Industry
Technology
: LoRaWAN
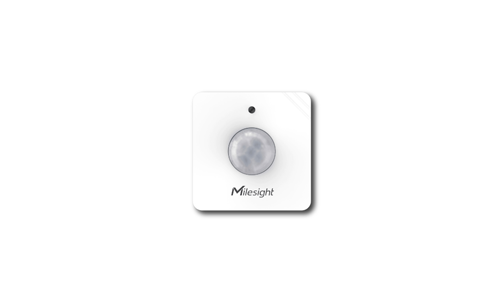
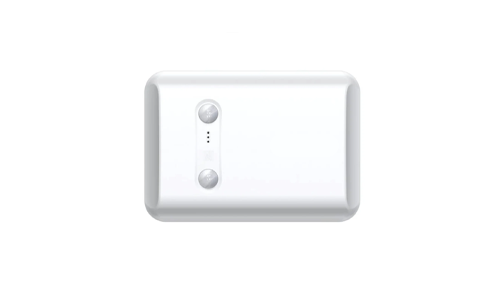
PIR & Light Sensor
Manufacturer:
Milesight
Manufacturer Product ID
: WS202
Urbana Product ID
: PL04EU0BT_00
Industry
: Building
Technology
: LoRaWAN
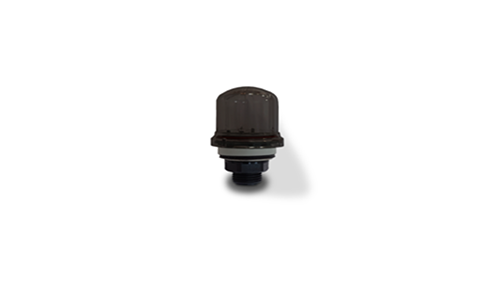
Zhaga Sensor
Manufacturer
: Urbana
Manufacturer Product ID
: RFTZEU00T_01
Urbana Product ID
: RFTZEU00T_01
Industry
: City
Technology
: LoRaWAN
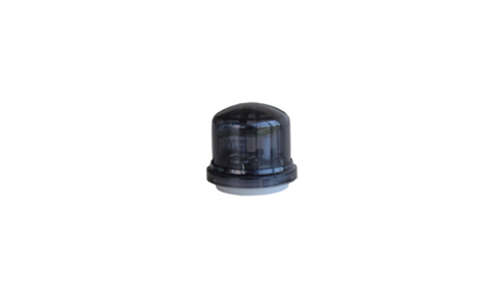
Zhaga Sensor
Manufacturer
: Urbana
Manufacturer Product ID
: RFTZEU00T_00
Urbana Product ID
: RFTZEU00T_00
Industry
: City
Technology
: LoRaWAN
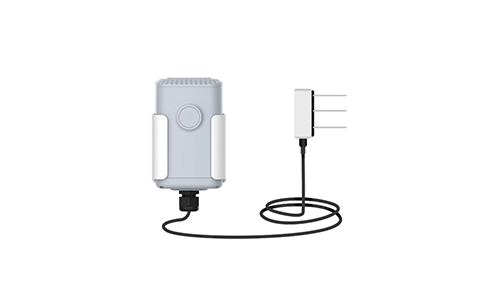
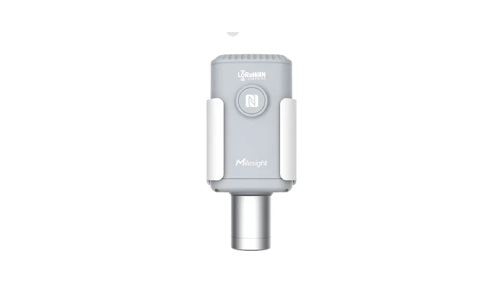
Soil Monitoring Sensor
Manufacturer
: Milesight
Manufacturer Product ID
: EM500-SMTC
Urbana Product ID
: SO01EU0BT_00
Industry
: Agriculture
Technology
: LoRaWAN
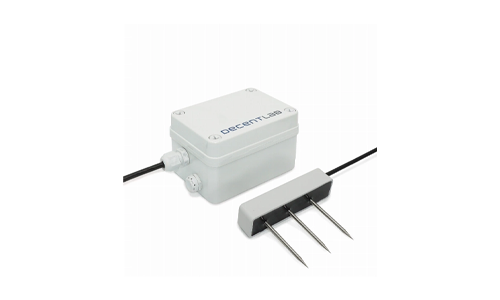
Soil Monitoring Sensor
Manufacturer
: Decentlab
Manufacturer Product ID
: DL-TRS12
Urbana Product ID
: SO03EU0BT_00
Industry
: Agriculture
Technology
: LoRaWAN
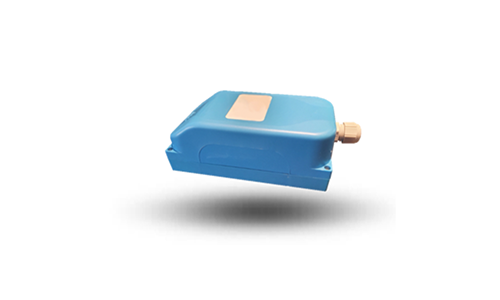
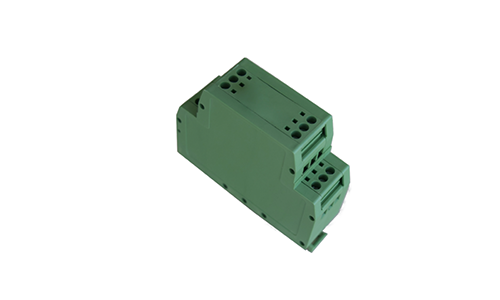
Valve Controller
Manufacturer
: Strega
Manufacturer Product ID
:
SEF-EU868
Urbana Product ID
: ST02EU00T_00
Industry
: Building, City, Industry
Technology
: LoRaWAN
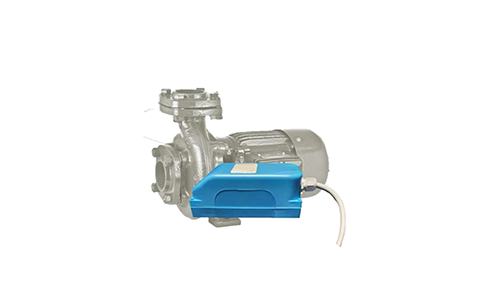
Pump Controller
Manufacturer
: Strega
Manufacturer Product ID
:
SSF-EU868
Urbana Product ID
: ST03EU00T_00
Industry
: Building, City, Industry
Technology
: LoRaWAN
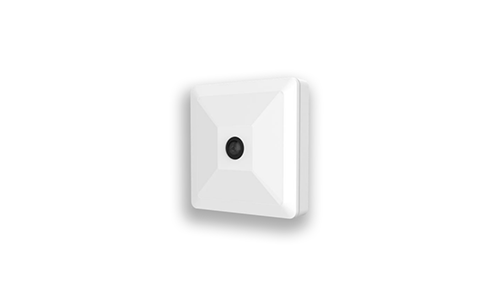
AI Workplace Sensor
Manufacturer
: Milesight
Manufacturer Product ID
: VS121
Urbana Product ID
: CC01EU00T_00
Industry
: Building
Technology
: LoRaWAN
Metering Modem Single-Phase
Manufacturer
: Urbana
Manufacturer Product ID
:
MTMDEU000_01
Urbana Product ID
: MTMDEU000_01
Industry
: Building, City, Utility
Technology
: LoRaWAN
Metering Modem Three-Phase
Manufacturer
: Urbana
Manufacturer Product ID
: MTMTEU00T_00
Urbana Product ID
: MTMTEU00T_00
Industry
: Building, City, Utility
Technology
: LoRaWAN
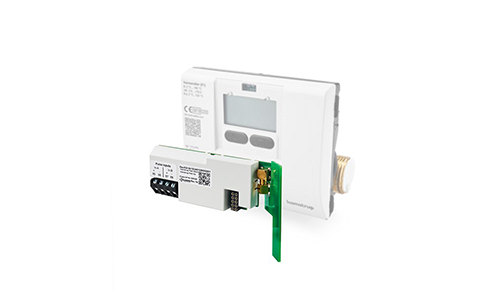
Thermal Energy Meter
Manufacturer
: Kamstrup
Manufacturer Product ID
:
403WF027881200
Urbana Product ID
:
HM01EU00T_00
Industry
: Building, City, Utility
Technology
: LoRaWAN
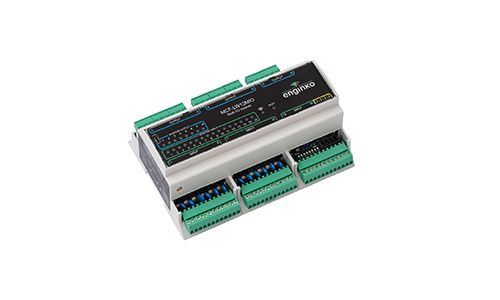
Multi I/O Module
Manufacturer:
Enginko
Manufacturer Product ID
:
MCF-LW13MIO
Urbana Product ID
: IO02EU00T_00
Industry
: Building, Industry
Technology
: LoRaWAN
People Counter Sensor
Manufacturer
:
PMX Systems AG
Manufacturer Product ID
:
PCR2-EU868-ODS
Urbana Product ID
: PC01EU0BT_00
Industry
: Building
Technology
: LoRaWAN
3D ToF People Counting Sensor
Manufacturer
: Milesight
Manufacturer Product ID
: VS132
Urbana Product ID
: PC02EU0BT_00
Industry
: Building
Technology
: LoRaWAN
Traffic Counter Sensor (Low Speed)
Manufacturer
:
PMX Systems AG
Manufacturer Product ID
:
TCR-DLI/LS/EU868
Urbana Product ID
: TR01EU00T_00
Industry
: City
Technology
: LoRaWAN
Traffic Counter Sensor (High Speed)
Manufacturer
: PMX Systems AG
Manufacturer Product ID
:
TCR-DLI/HS/EU868
Urbana Product ID
: TR03EU00T_00
Industry
: City
Technology
: LoRaWAN
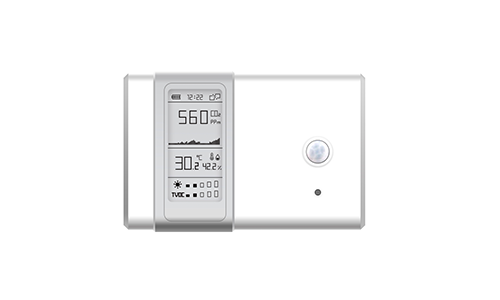
Indoor Ambience Monitoring Sensor
Manufacturer
: Milesight
Manufacturer Product ID
:
AM107-868M
Urbana Product ID
: AM01EU0BT_00
Industry
: Building
Technology
: LoRaWAN
Indoor Temperature & Humidity Sensor
Manufacturer
: Dragino
Manufacturer Product ID
: LHT52
Urbana Product ID
: AM05EU0BT_00
Industry
: Building, City
Technology
: LoRaWAN
Carbon Dioxide Sensor (4 in 1)
Manufacturer
: Milesight
Manufacturer Product ID
: EM500-CO2
Urbana Product ID
:
WH10EU0BT_00
Industry
: Building, City
Technology
: LoRaWAN
Passage People Counter
Manufacturer
: Milesight
Manufacturer Product ID
: VS350
Urbana Product ID
: MI0000055_00
Industry
: Building
Technology
: LoRaWAN
Leak Detection Sensor
Manufacturer
: Milesight
Manufacturer Product ID
: EM300-SLD/ZLD
Urbana Product ID
: WL02EU0BT_00
Industry
: Building
Technology
: LoRaWAN
Water Temperature Monitor
Manufacturer
:
Wavetrend
Manufacturer Product ID
:
SD01
U
rbana
Product
ID
:
TH04EU0BT_00
Industry
:
Health, Building
Technology
: LoRaWAN
Optical Dissolved Oxygen & Temperature Sensor
Manufacturer
: DecentLab
Manufacturer Product ID
: DL-OPTOD
Urbana Product ID
: DE0000002_00
Industry
: City
Technology
: LoRaWAN
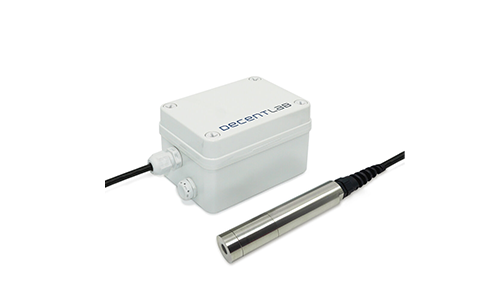
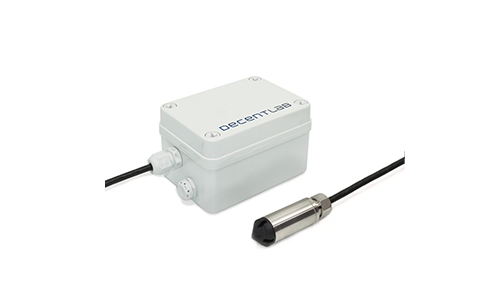
Pressure/Liquid Level & Temperature Sensor
Manufacturer
: DecentLab
Manufacturer Product ID
: DL-PR26
Urbana Product ID
: DE0000001_00
Industry
: City
Technology
: LoRaWAN
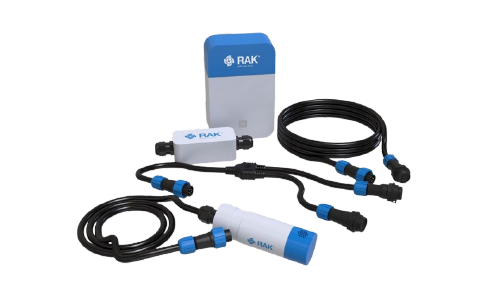
SensorHub 3-Axis Accelerometer & Magnetic Contact
Manufacturer
: RAK Wireless
Manufacturer Product ID
: RAK2560
Urbana Product ID
: RA0000005_00
Industry
: Building, City
Technology
: NB-IoT/LTE Cat.M
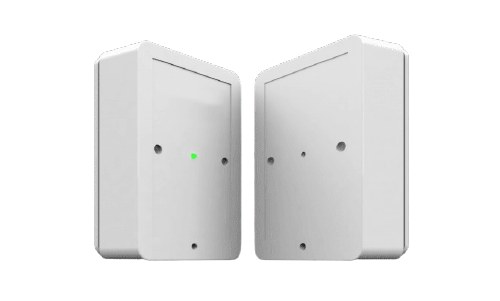
Infrared People Counter
Manufacturer
: IMBuildings
Manufacturer Product ID
: N/A
Urbana Product ID
: PC03EU0BT_00
Industry
: Building
Technology
: LoRaWAN
CO2, Temperature, Humidity and Pressure Sensor
Manufacturer
: Decentlab
Manufacturer Product ID
:
DL-LP8P
Urbana Product ID
: DE0000004_00
Industry
: Building, City
Techology
: LoRaWAN
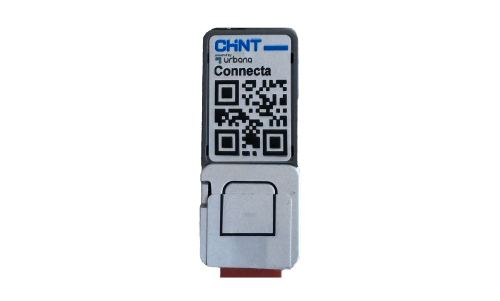
CHINT Connecta Gateway
Manufacturer
: Urbana
Manufacturer Product ID
:
EL01GLN00
Urbana Product ID
: EL01GLN00_00
Industry
: Building, City, Utility, Industry
Techology
: NB-IoT
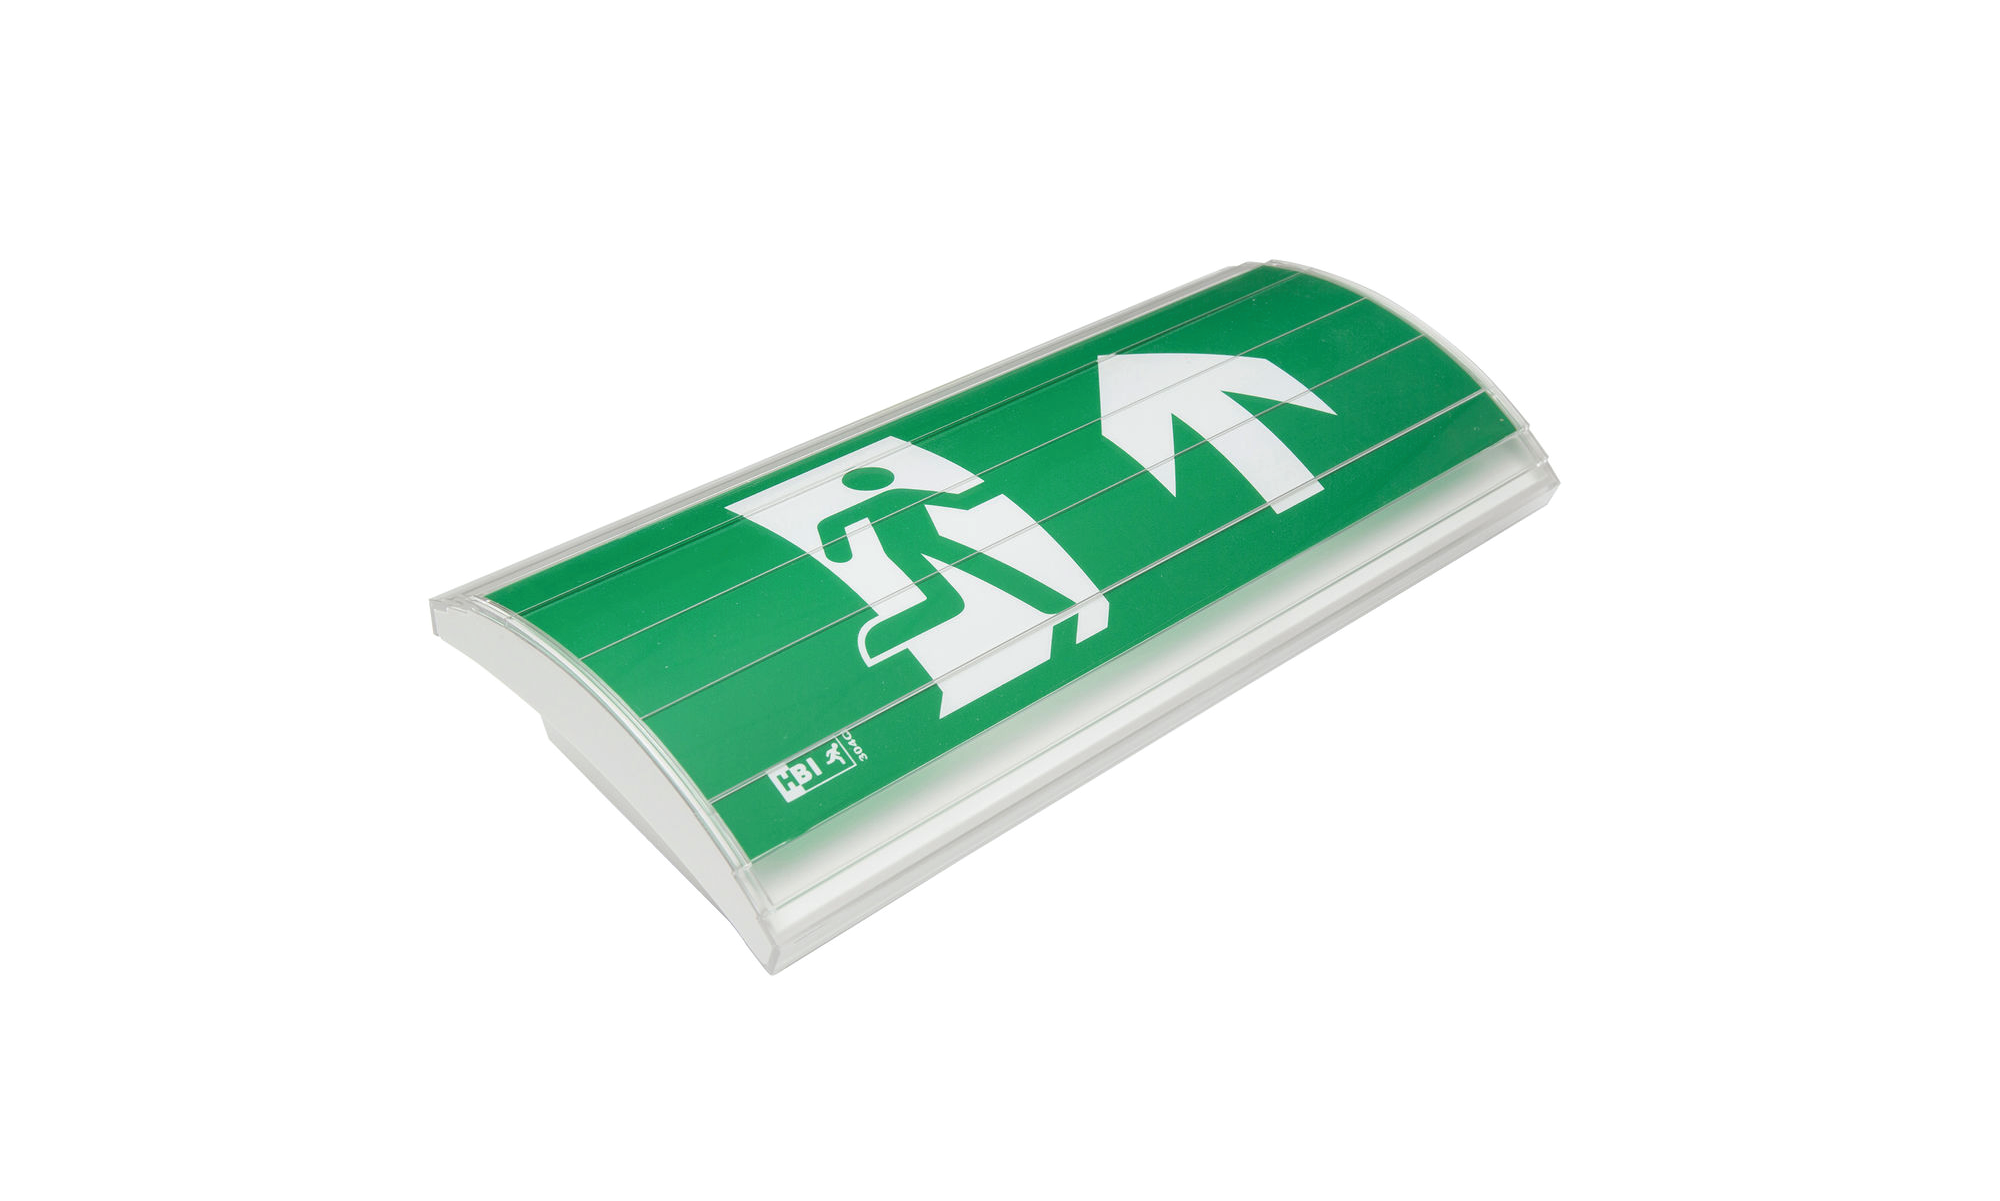
Emergency Light
Manufacturer
: HBI
Manufacturer Product ID
:
3Y0606F
Urbana Product ID
: HB0000002_00
Industry
: Building, Utility, Industry
Techology
: LoRaWAN
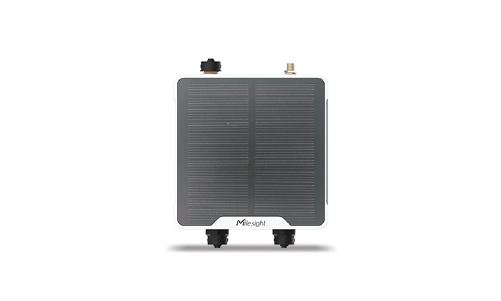
Solenoid Valve Controller
Manufacturer
: Milesight
Manufacturer Product ID
:
UC51x
Urbana Product ID
: VC01EU0BT_00
Industry
: Building, Utility, Industry
Techology
: LoRaWAN